
765ktick updates / sec
WebGL2, built for the hot path
GPU-instanced candles, layered canvases with a dirty-flag scheduler, and O(1) pan/zoom via shader uniforms. Ticks mutate the last bar in place; React is never in the loop.
Open source · MIT · WebGL2
High-frequency ticks, 90 indicators computed off the main thread, 42 drawing tools, multi-pane layouts and an AI-ready MCP control surface. Standalone, free, MIT-licensed. The chart below is the real thing: pick a tool from the rail and draw on it.
One engine, every layout
Six more live instances, each a different instrument, timeframe and indicator stack. Every chip below is real: click one and that chart reconfigures on the spot.
GPU-instanced candles, layered canvases with a dirty-flag scheduler, and O(1) pan/zoom via shader uniforms. Ticks mutate the last bar in place; React is never in the loop.
Moving averages, oscillators, bands, trend, volume and volatility, all computed in a Web Worker and committed once, so the chart never stutters under analysis.
The engine owns the canvases; your app owns every pixel of chrome. Toolbars, HUDs, context menus and modals are yours, so it drops into any design system.
A deterministic, MCP-compatible tool schema and executor lets an AI agent (or your own automation) drive the chart exactly the way a user does.
Trend lines, Fibonacci, pitchforks, Gann, Elliott waves, position boxes, each with handles, magnet snapping and undo/redo. Plus seven chart types, four price-scale modes, multi-pane layouts, markers and compare modes.
No tiers, no watermark, no "contact sales" features. Fork it, extend it, ship it. Commercial use included, forever.
Headless by design
Identical bars, identical indicators, identical integration code. The engine ships zero CSS classes, so the palette, the typography and every piece of chrome are yours to write.
Same bars. Same EMA and volume pane. Same <FastFinancialChart /> call. Everything else is your HTML.
Quick start
Declare series and indicators as props; push live ticks through the ref so high-frequency updates never touch React. Pick a tab to see each snippet and the chart it produces.
Read the full API docsimport { FastFinancialChart }from '@pairlens/fast-financial-charts/react'export function Minimal({ bars }) {return (<FastFinancialChartseries={[{ id: 'BTC-USD', bars }]}timeframe="1m"/>)}
// 90 built in. Each one names the// series it reads, and whether it// overlays price or gets its own pane.<FastFinancialChartseries={[{ id: 'BTC-USD', bars }]}indicators={[{ type: 'EMA', seriesId: 'BTC-USD',params: { period: 21 } },{ type: 'RSI', seriesId: 'BTC-USD',pane: 'separate' },]}/>
// Same-bucket ticks mutate the last bar// in place; a tick past the boundary// rolls a new bar automatically.chartRef.current?.applyTick({seriesId: 'BTC-USD',ts: Date.now(),price: 64020.5,volume: 0.12,})// Burst ingestion for batched feedschartRef.current?.applyTicks(batch)
import { createChartMcpAdapter }from '@pairlens/fast-financial-charts/mcp'// 52 deterministic, MCP-ready tools.const mcp = createChartMcpAdapter(chartRef.current,)await mcp.execute('addIndicator', {type: 'BollingerBands',seriesId: 'BTC-USD',params: { period: 20, stdDev: 2 },})
Battle-tested daily
This isn't a demo project. It's the engine rendering live markets in the Pairlens terminal every day: streaming order flow, indicator stacks, drawings, and an AI assistant driving the chart through the same MCP tools you get.
Meet the Pairlens terminal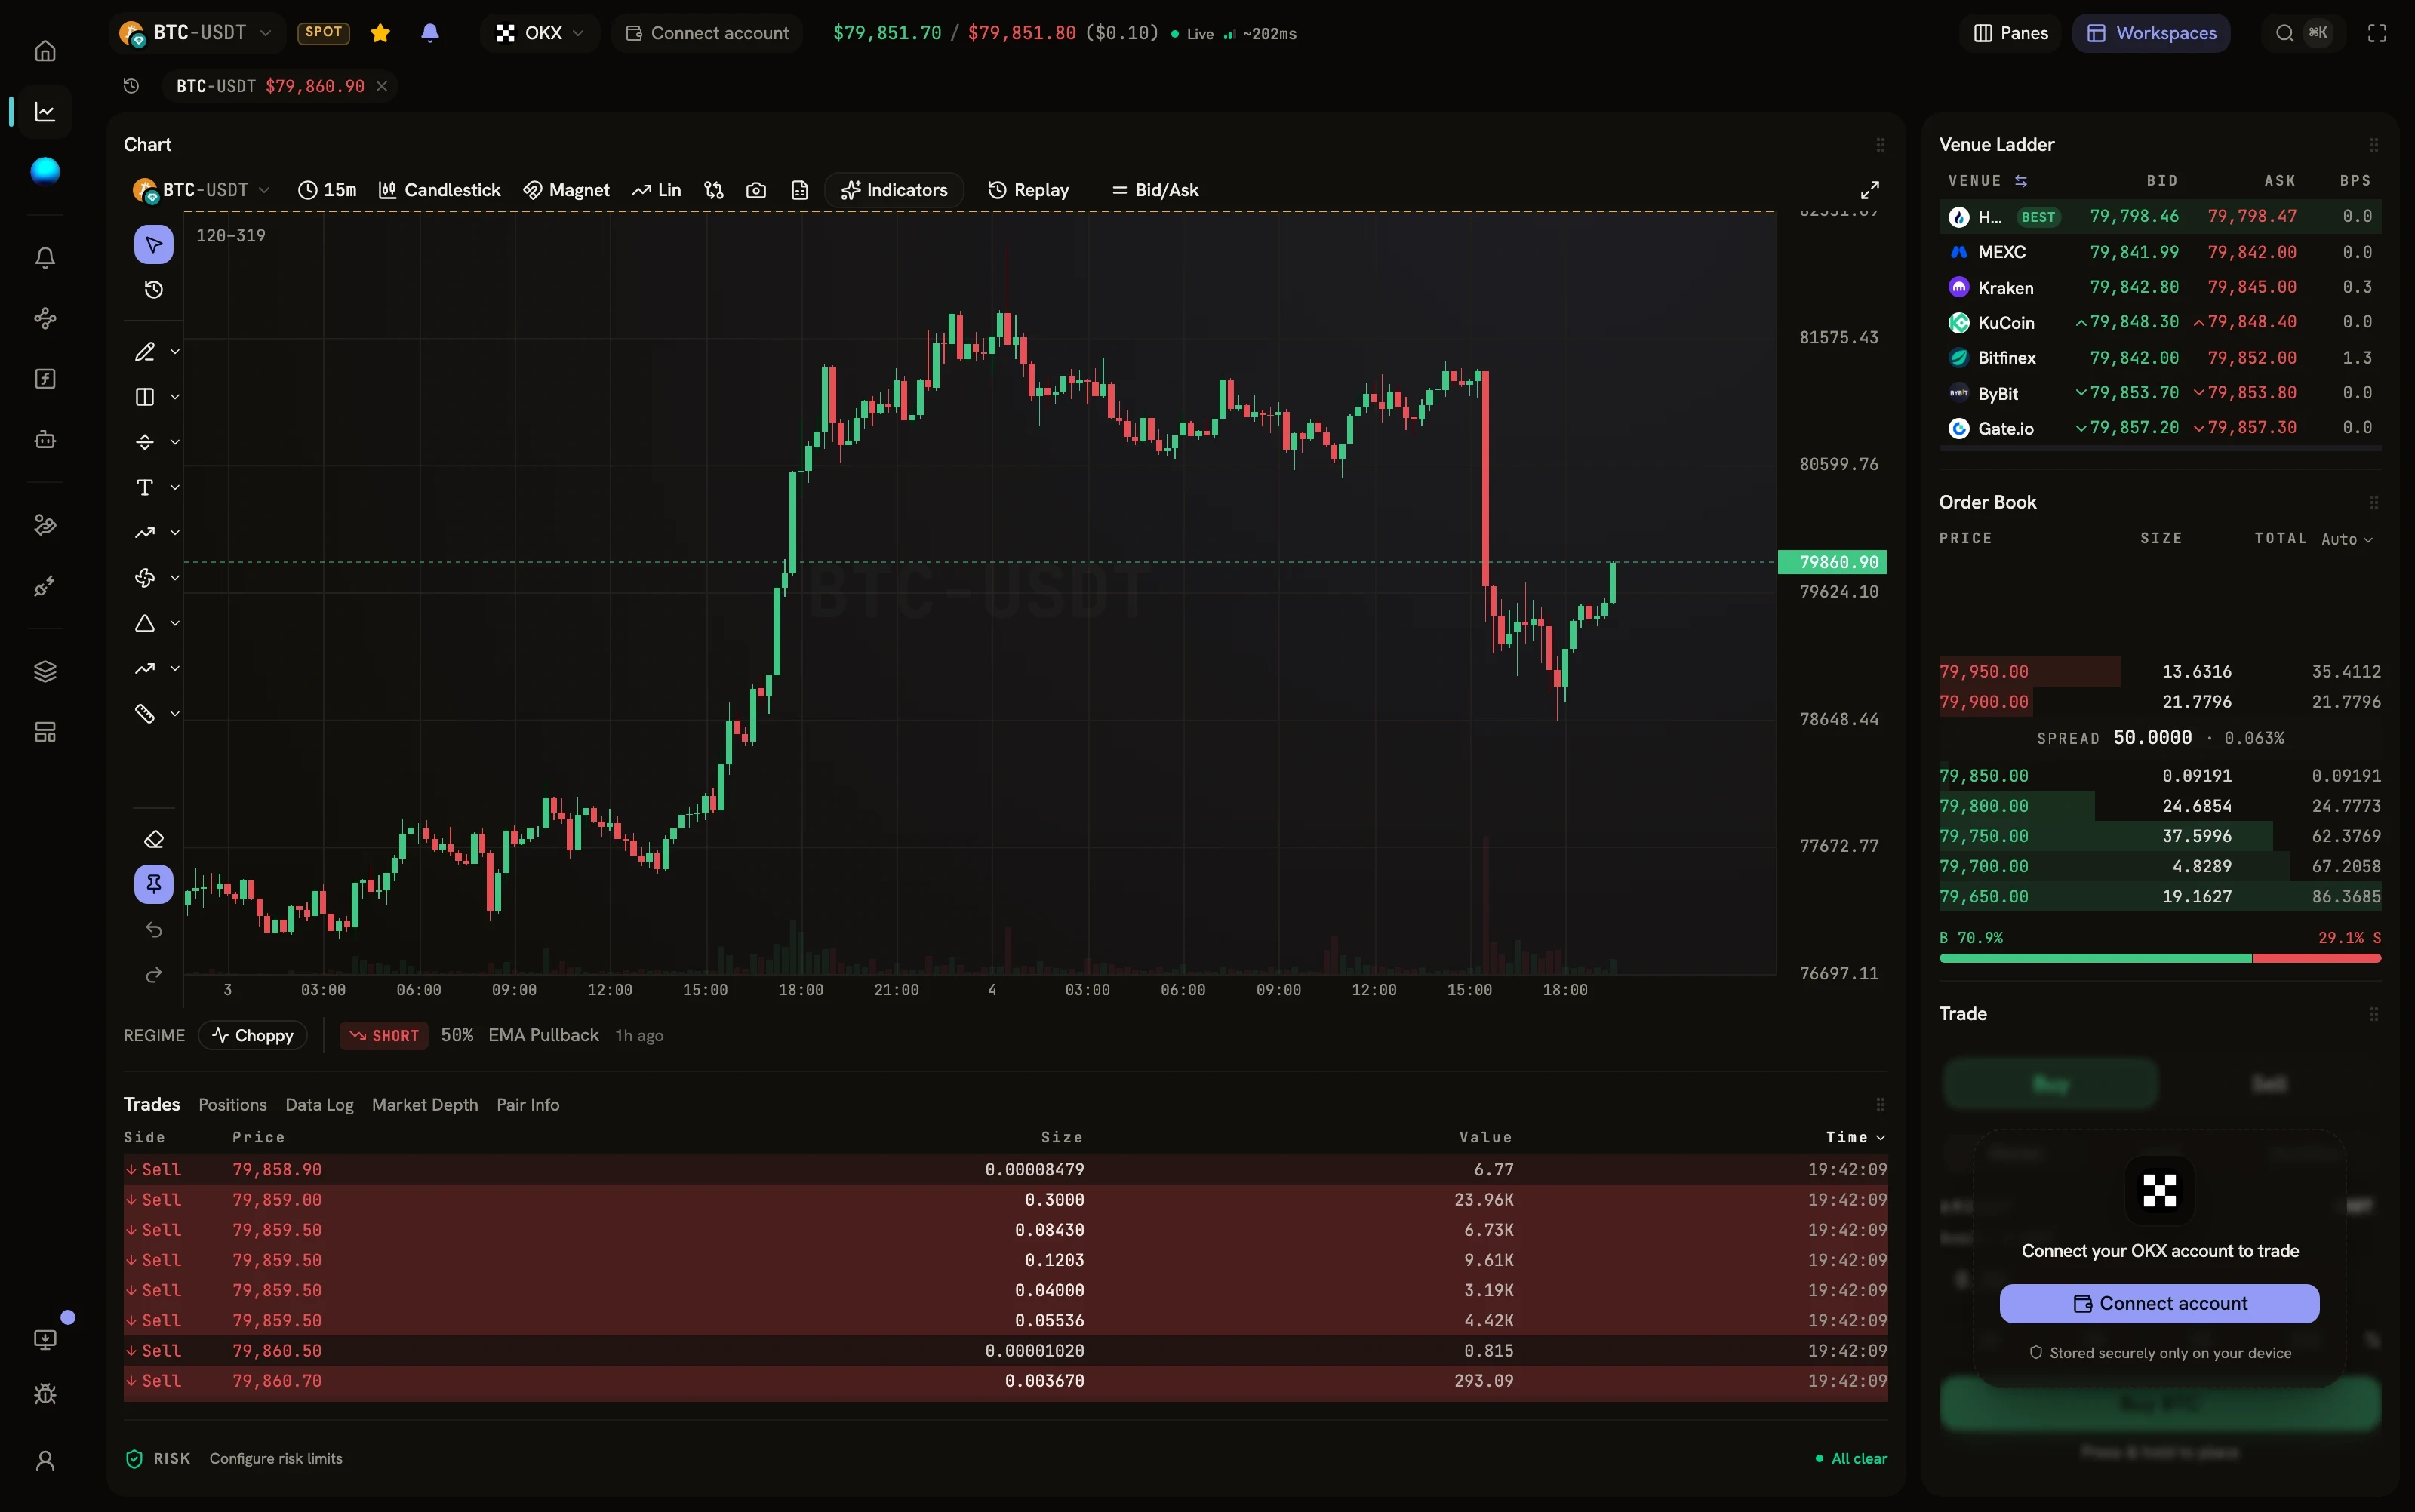
Everything in the repo is yours under MIT, commercial products included. If you build something with it, we'd love to see it.
One cookie, maybe
Our analytics is anonymous and cookieless. No ads, no cross-site tracking. Accept and a single first-party cookie remembers you between visits. Decline and nothing is stored at all. See the Privacy Policy.